


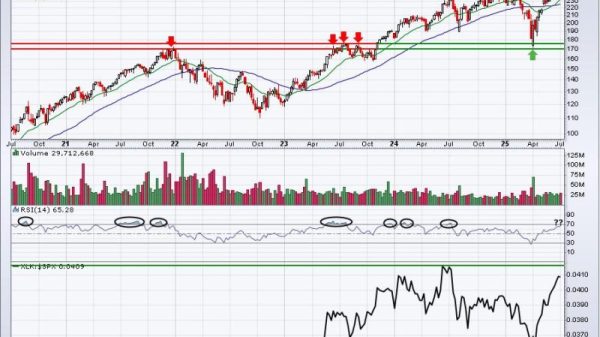


 Joe presents his game-changing “undercut and rally” trading pattern, which can be found in high volatility conditions and observed via RSI, MACD and ADX signals. Joe uses the S&P 500 ETF as a live case study, with its fast shake-out below support followed by an equally quick rebound; a good illustration of why lagging indicators can’t be trusted right after a vertical drop.
In addition, Joe maps out three possible scenarios for the S&P: (1) an orderly pullback, (2) a disorderly slide that erases moving-average support, or (3) a breakout. He closes by analyzing viewer requests, spotlighting DOCS and KMI for constructive consolidations, and flagging PGEN as still too weak for a swing entry.
The video premiered on June 18, 2025. Click this link to watch on Joe’s dedicated page.
Archived videos from Joe are available at this link. Send symbol requests to stocktalk@stockcharts.com; you can also submit a request in the comments section below the video on YouTube. Symbol Requests can be sent in throughout the week prior to the next show.