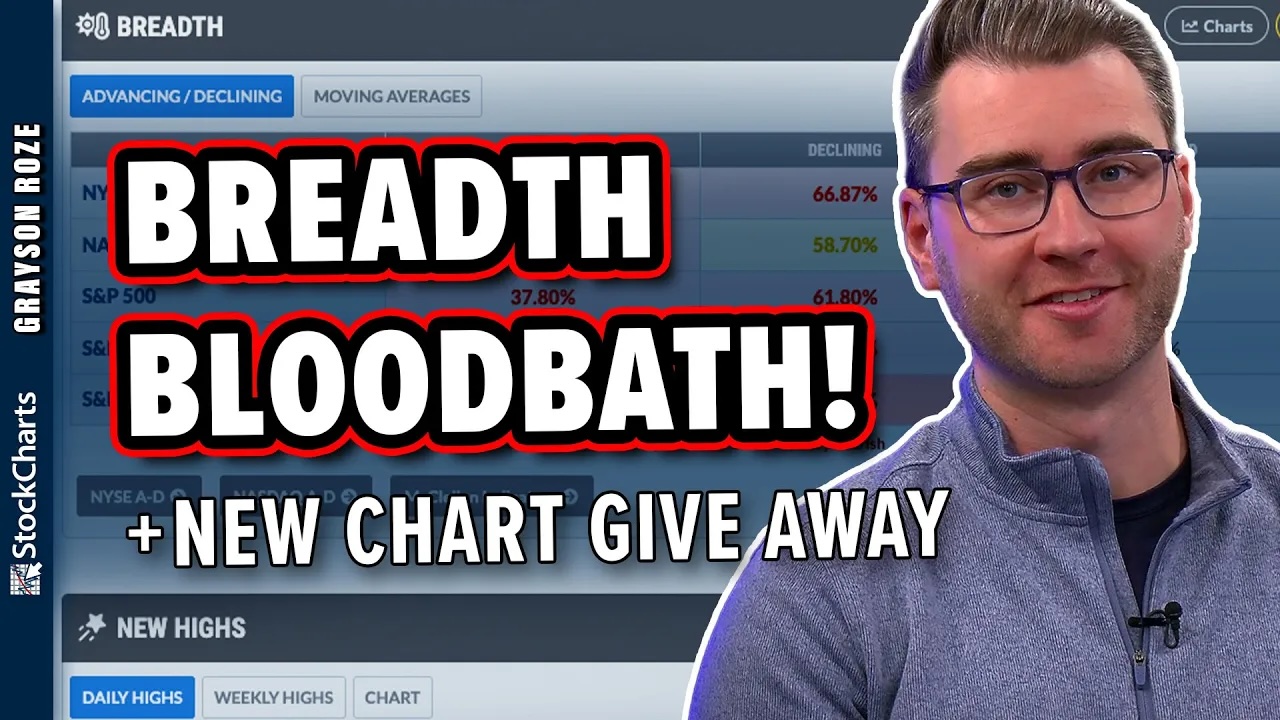
 In this video, Grayson unveils StockCharts’ new Market Summary ChartPack—an incredibly valuable new ChartPack packed full of pre-built charts covering breadth, sentiment, volatility data and MUCH MORE!
From there, Grayson then breaks down what he’s seeing on the current Market Summary dashboard, illustrating how he’s putting this invaluable tool to work in the current climate. He highlights weakness in Small Cap stocks, uses the Factors Map to pinpoint the groups that investors are gravitating to, and explains why the sea of red across the breadth maps continues to be a clear indication of the weakness in this market.
This video originally premiered on April 18, 2024. Click on the above image to watch on our dedicated Grayson Roze page on StockCharts TV.
You can view previously recorded videos from Grayson at this link.


