


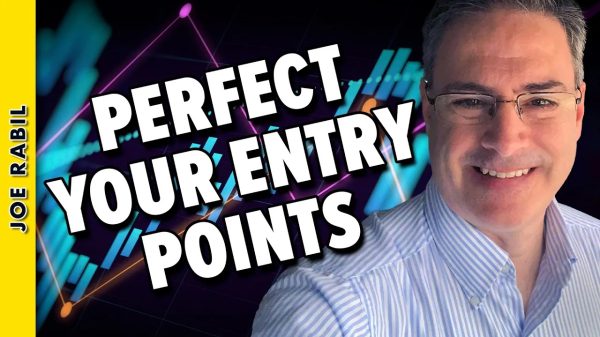


The Home Construction ETF (ITB) is leading the market as it surged to a new closing high this week. While this high is certainly bullish and points to upside leadership, the real signal triggered back in early July as the Trend Composite turned bullish with an outsized move. Let’s review this signal and then look at a recent signal in Home Depot.
The chart below shows ITB with the Trend Composite and Normalized ROC. The Trend Composite aggregates signals in five trend-following indicators. Normalized ROC is the 5 period point change divided by ATR(5), which shows price moves in ATR terms. Values greater than +3 indicate that price advanced more than 3 ATR(5) values in five days. This is an outsized move that can kick start an extended uptrend. Note that these indicators are part of the TIP Indicator Edge for StockCharts ACP (here).
The chart above shows three signals coming together in mid November 2023 and mid July 2024. Notice how ITB broke resistance with an outsized move in early November and the Trend Composite followed with a bullish signal in mid November. ITB corrected into early July and another bullish trio triggered in mid July. This most recent signal was highlighted in the ChartTrader reports at TrendInvestorPro.
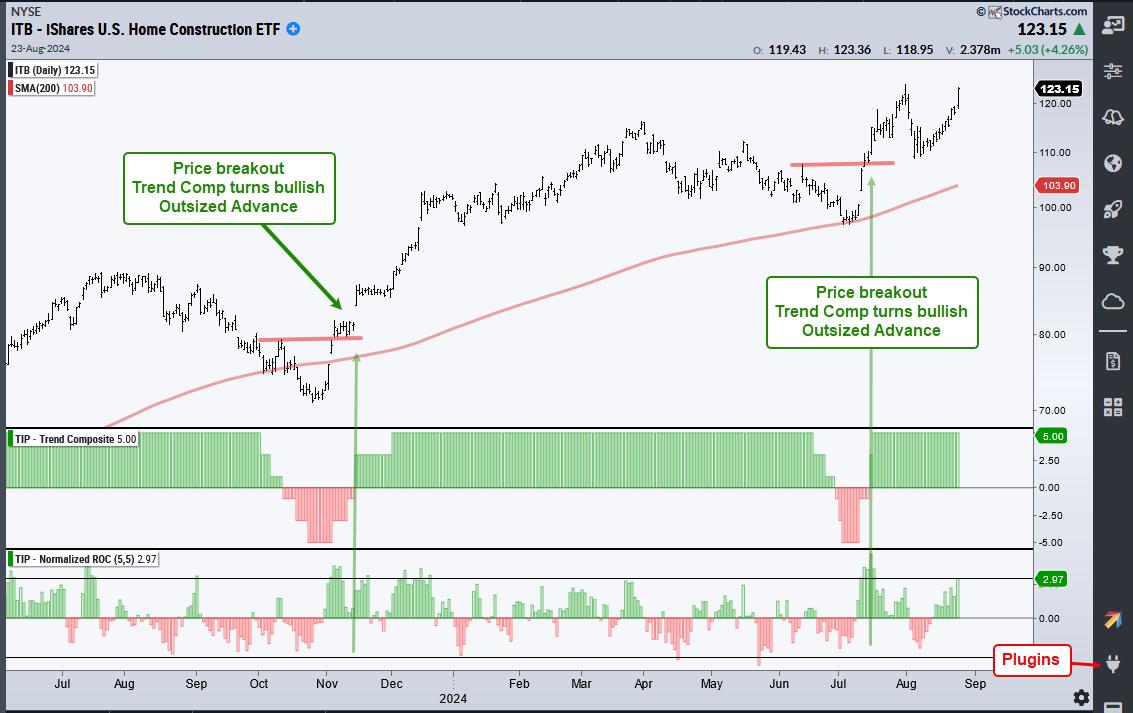
The next chart shows Home Depot with the signal trio occurring in November-December and June-July. Rarely do we get all three signals at the same time. Usually the price breakout and outsized move occur first. The Trend Composite is a trend-following indicator that triggers when there is upside follow through.
All trend-following indicators lag and produce some whipsaws. The Trend Composite is no different as it whipsawed with by turning negative twice in August. This is normal given the broad market volatility we saw over the last six weeks. The Trend Composite surged to +5 on Friday and this means all five indicators are on bullish signals. The blue lines show support levels from July and now August.
ChartTrader recently introduced two new market timing models in our weekly report and video. One model covers the broad market and the other focuses on timing the Nasdaq 100. Our weekly report/video also covers the charts, setups and signals for SPY, QQQ, MAGS, TLT, GLD, key tech names and more. Click here to take your analysis process to the next level.
//////////////////////////////////////////////////