Note to the reader: This is the nineteenth in a series of articles I’m publishing here taken from my book, “Investing with the Trend.” Hopefully, you will find this content useful. Market myths are generally perpetuated by repetition, misleading symbolic connections, and the complete ignorance of facts. The world of finance is full of such tendencies, and here, you’ll see some examples. Please keep in mind that not all of these examples are totally misleading — they are sometimes valid — but have too many holes in them to be worthwhile as investment concepts. And not all are directly related to investing and finance. Enjoy! – Greg
Relative Strength
Back in the 1970s, we used to have an indicator that looked at the volume on the American Stock Exchange (AMEX), also known as the curb, and the volume on the New York Stock Exchange (NYSE), known as the big board. It was called The Speculation Index. The AMEX consisted of small, relatively illiquid issues, generally all that could not make the listing requirements of the NYSE. The ratio of AMEX volume to NYSE volume was thought to represent excessive optimism when it reached a certain level.
In perfect hindsight, I think if we had used it as a trend indicator, it would have been more valuable. Identify the rising path of speculation and as the volume of the AMEX increased relative to that of the NYSE, you would be in a good uptrend.
Note: In 2008, the AMEX was acquired by the NYSE Euronext, which announced that the exchange would be renamed the NYSE Alternext US. The latter was renamed NYSE Amex Equities in March 2009. These changes have made stand-alone AMEX trading volumes difficult to source and track, as a result of which, the speculation index has lost much of its relevance as a measure of speculative activity.
Small-Cap vs. Large-Cap Component
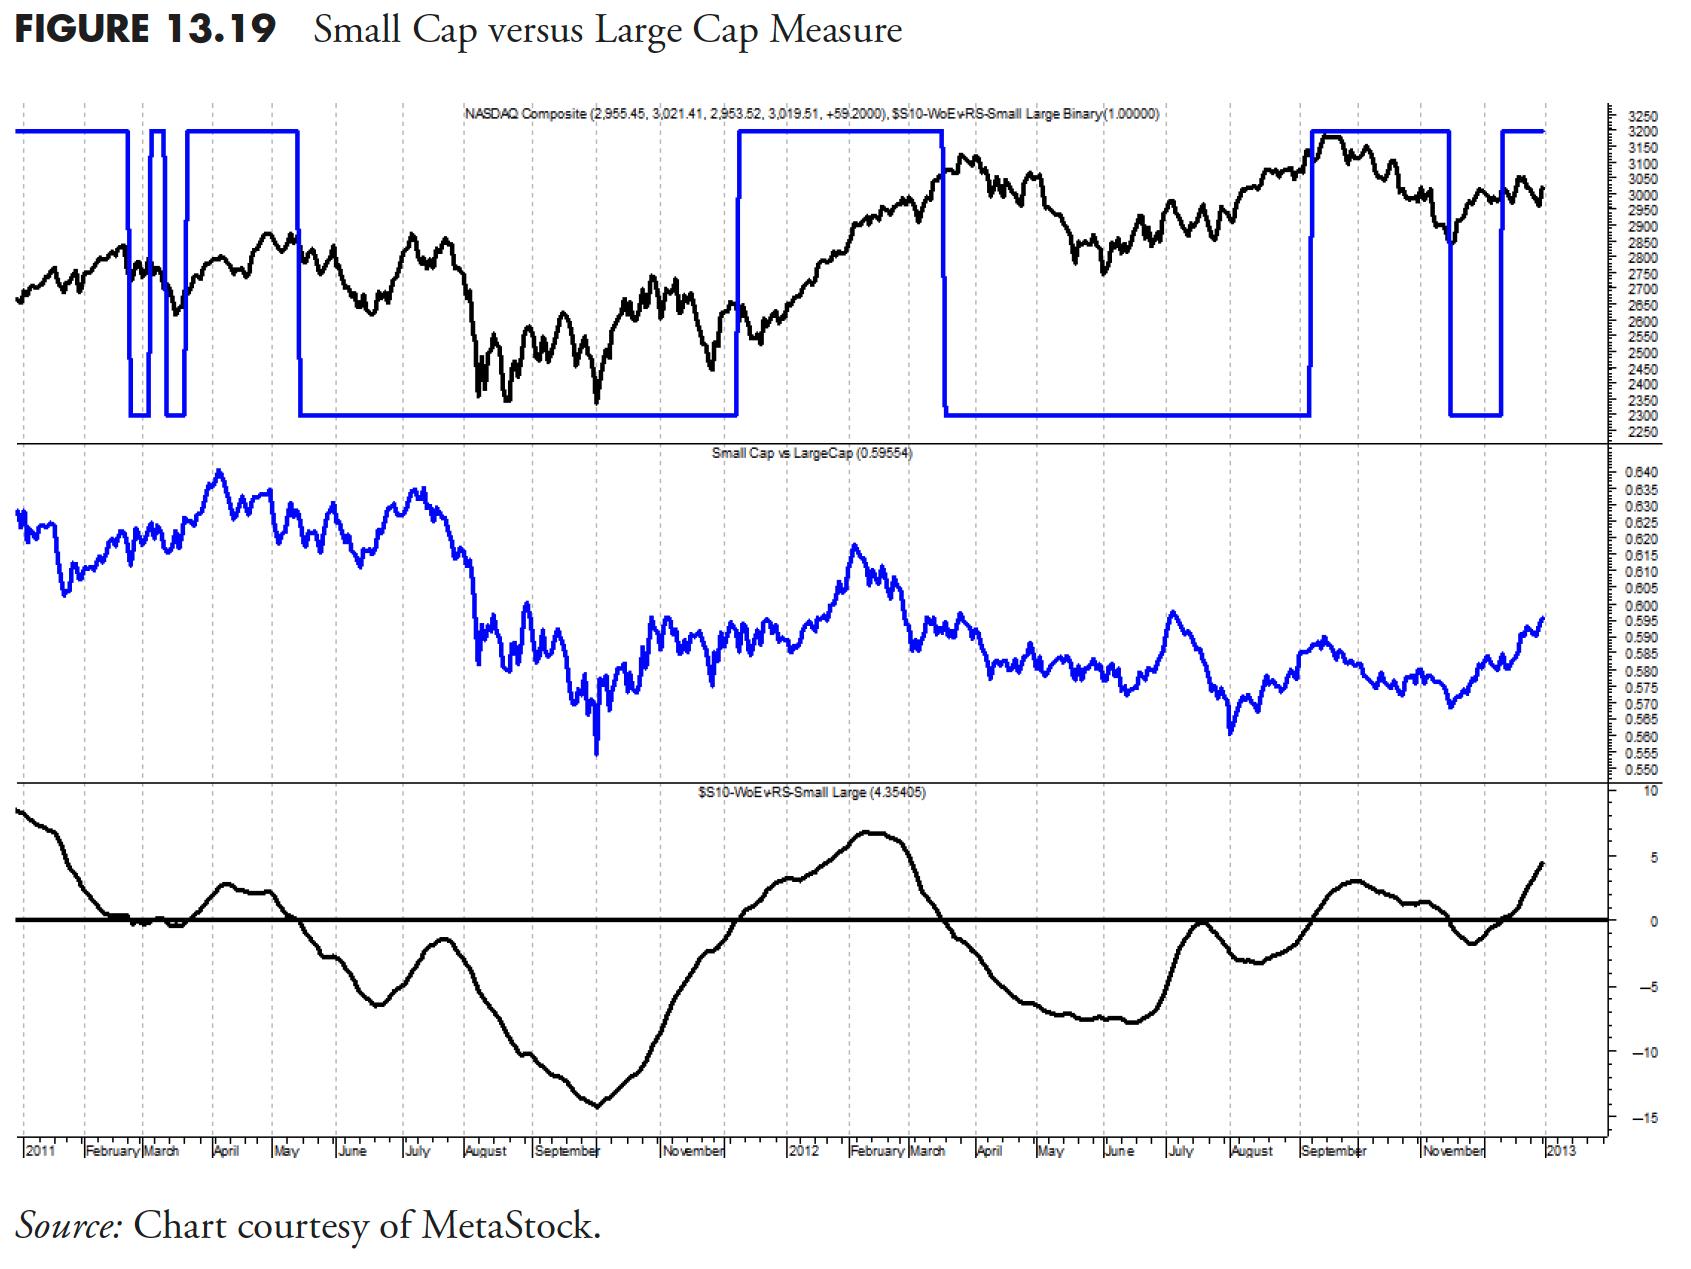
Small-cap participation is critical for sustained uptrends in the market because small-caps reflect speculation and speculation is a requirement for uptrends. For small capitalization issues, the Russell 2000 Index is used, and for large capitalization issues, the venerable S&P 500 Index is used. The math is simply to create the ratio of the small to large, then use technical analysis to provide a normalized trend measure.
In Figure 13.19 the typical Nasdaq Composite is in the top plot, along with the small-cap large-cap binary. The middle plot is just the ratio of the small to large issues, and the lower plot is the small-cap large-cap weight of the evidence measure. In this example, you can see that small caps dominated the up move near the center of the chart, but have been relatively weak since. If you think about it, small caps also more closely relate to breadth.
Growth vs. Value Component
This component of relative strength measures the difference between growth stocks and value stocks. Now this will shock most folks who have studied the markets, but I use small-cap issues for both the growth and value components. I was initially concerned that small cap value was almost an oxymoron, but the data has proved time and time again that it is perfectly valid. Figure 13.20 shows the growth value ratio in the middle, with the growth value weight of the evidence measure in the bottom plot and its binary overlaid in the top plot.

Breadth vs. Price Component
There is only one more relative strength measure to view, the relationship between breadth and price. For breadth, a relationship between the advancing issues and the declining issues is used, while the Nasdaq Composite is used for price. The middle plot in Figure 13.21 shows the raw ratio of those two, with the price to breadth weight of the evidence measure in the lower plot and its binary in the top plot. This is an excellent example of how technical manipulation of the data can turn that noisy middle plot into something like the bottom plot, and a good trend measure.

Relative Strength Compound Measure
This compound measure (see the previous article) is designed to measure market sentiment. Are investors actively taking investment risk? Or are they behaving much more bearishly? Again, there are three indicators that drive this component and are shown above. These indicators look at the relationship between small-cap issues vs. large-cap issues, growth-oriented issues vs. value issues, and breadth measurements vs. price measurements.
For example, when small-caps are dominant (small-caps outperforming large-caps) it is generally a sign of more speculation taking place in the markets, as investors are willing to accept more risk. This is generally a good sign, and it is during these environments that the markets generally perform well historically. When large-caps are dominant, it is usually the result of a flight to quality, as investors are taking risk off the table. This type of investor sentiment usually results in less favorable market conditions.
A similar relationship exists between growth and value. When growth issues are outperforming, it is generally because the market is pricing in favorable growth estimates, and conversely, when value issues are dominating, it is because the market is no longer pricing in such optimistic positive growth estimates. The breadth vs. price measurement is similar to an equal-weighted measurement versus a capitalization-weighted measurement. Again, we are using three indicators in this component for confirmation purposes. When this relative strength component is on, it is adding value to the weight of the evidence of the model by letting me know that the sentiment in the markets is favorable and is viewed more as a trend confirmation measure versus a trend identification measure.
Figure 13.22 is a chart showing lots of data but includes all three components of the relative strength measure. The top plot is the Nasdaq Composite with the compound binary measure overlaid. The binary measure for each of the components is also shows overlaid on their respective plots.

Figure 13.23 is the same as the preceding figure, but with less data displayed.

Dominant Index
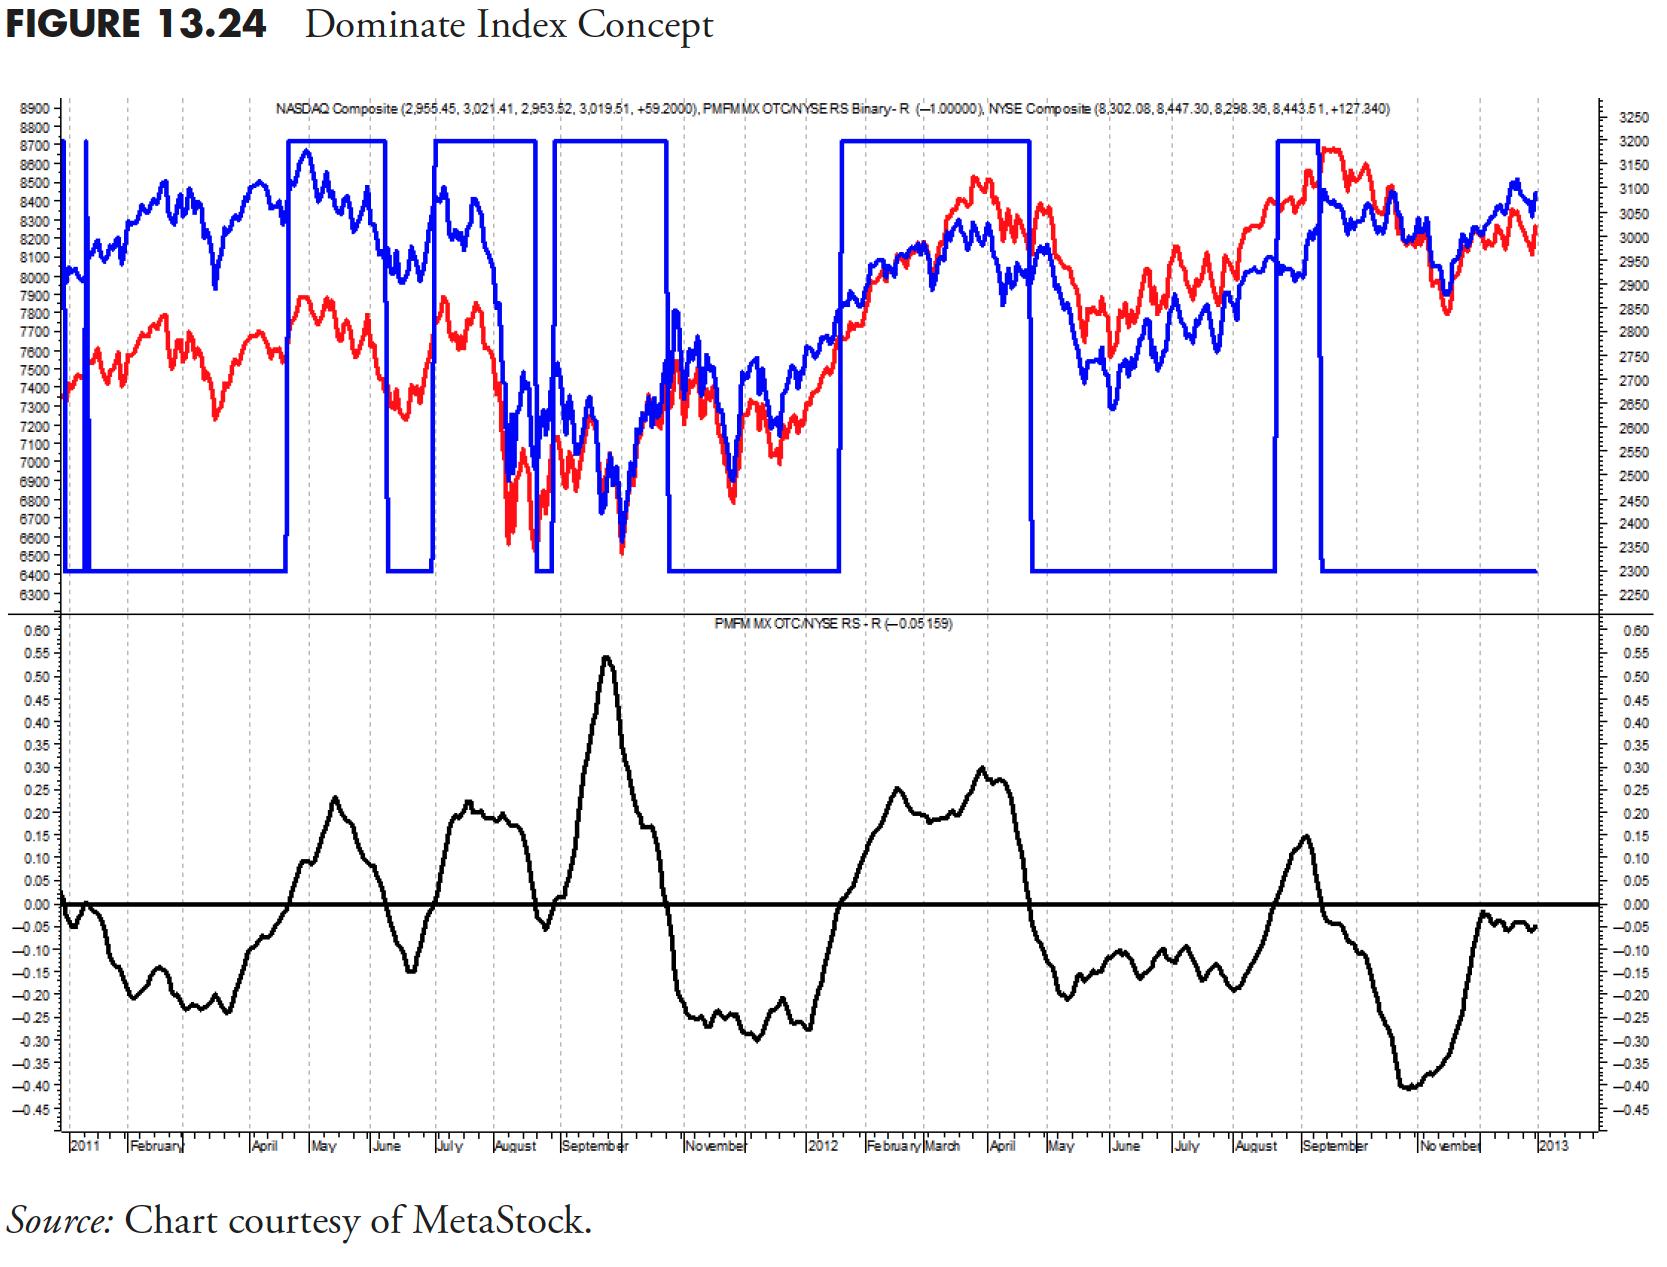
A concept known as the Dominant Index measures the relative strength between the Nasdaq Composite and the New York Stock Exchange (NYSE) Composite. The Nasdaq is generally dominated by small capitalization issues and the NYSE is dominated by large capitalization issues. Therefore, a measure that shows which is outperforming is also showing whether small cap issues are outperforming large-cap issues or vice versa.
Figure 13.24 shows the Nasdaq Composite and the NYSE Composite in the top plot, with the relationship between the two displayed in the bottom plot. Whenever the line is above the horizontal line, it means the Nasdaq is performing better than the NYSE. In the last decade, the Nasdaq has grown considerably with many more large-cap issues, which somewhat hampers this measure.
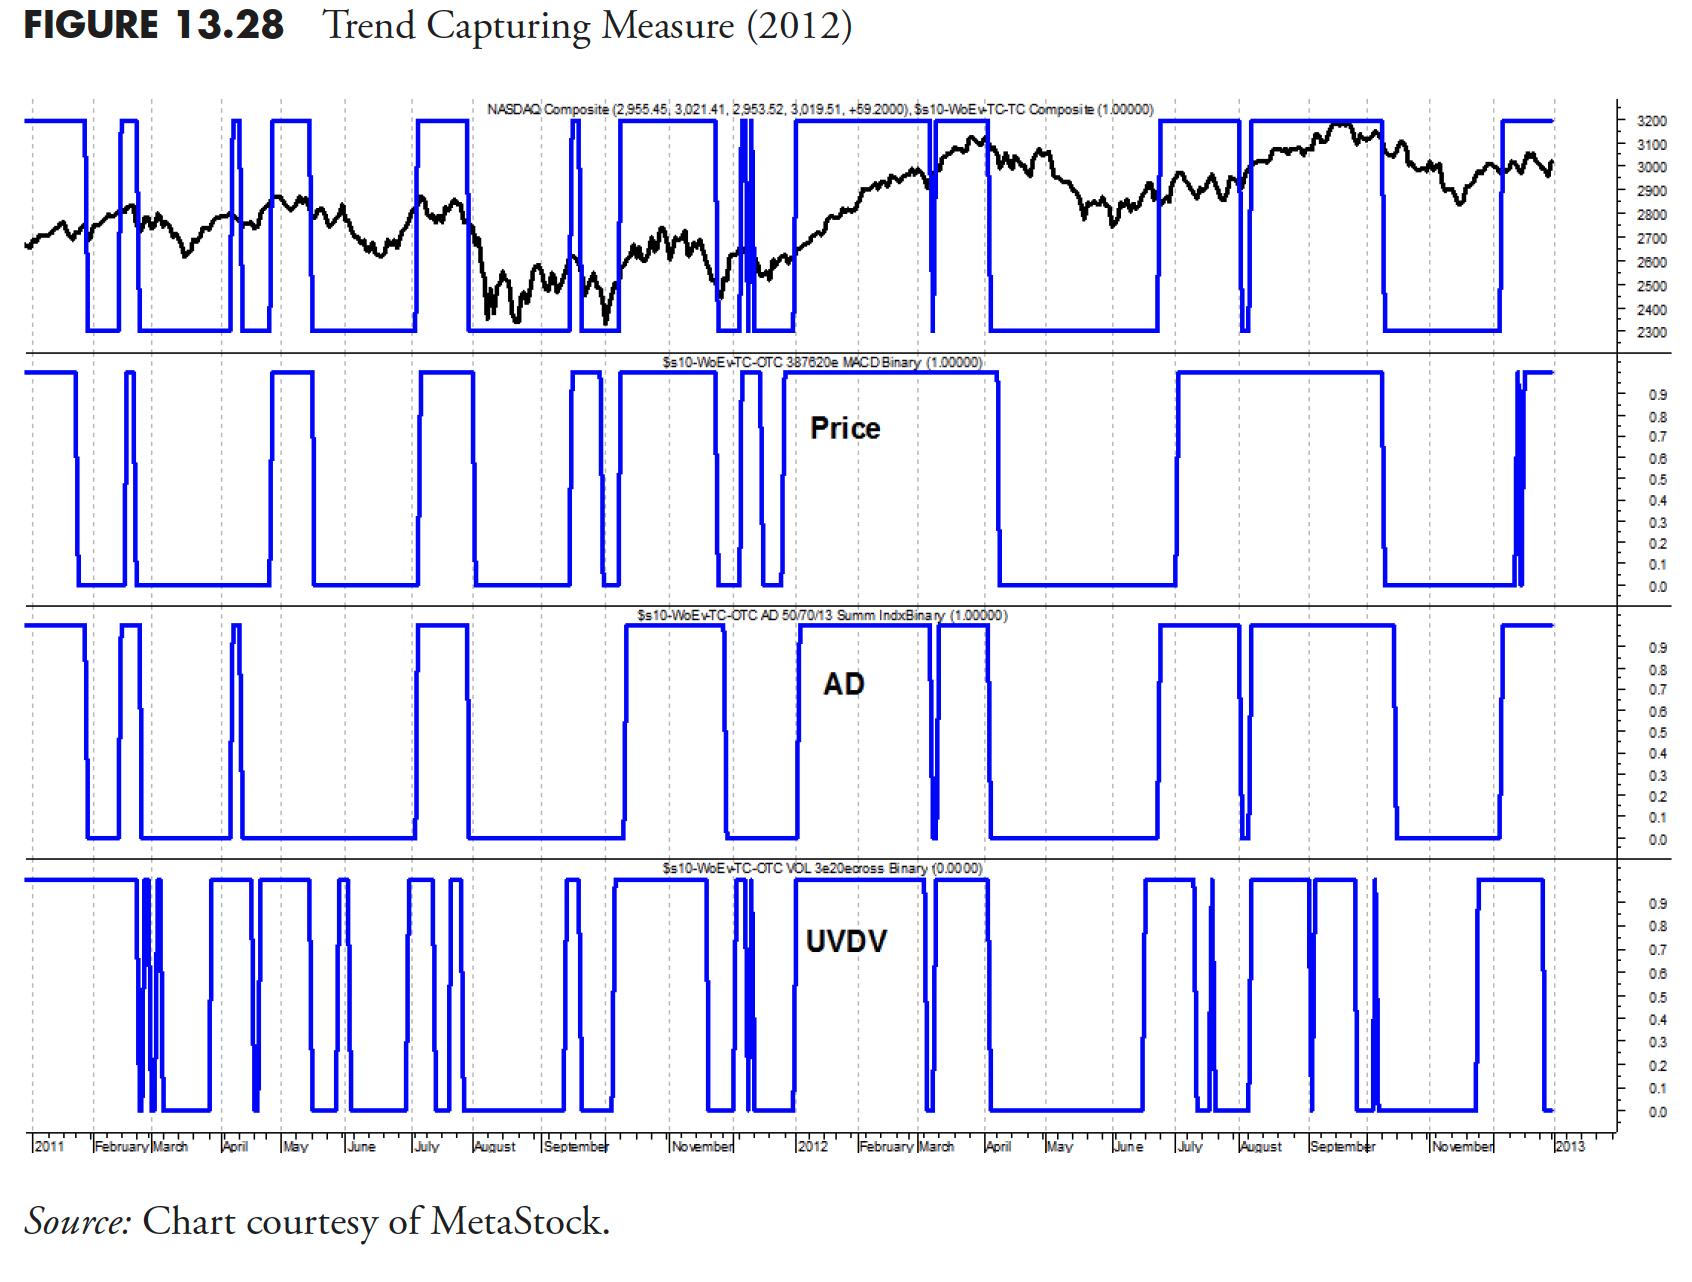
Trend Capturing Measure
This is a truly important compound measure, which can drive the weight of the evidence or hold it back. The trend capturing measure, like many compound measures, consists of three independent indicators of trend, and in this case two are based on breadth and one on price. Any two measures saying there is an uptrend will work.
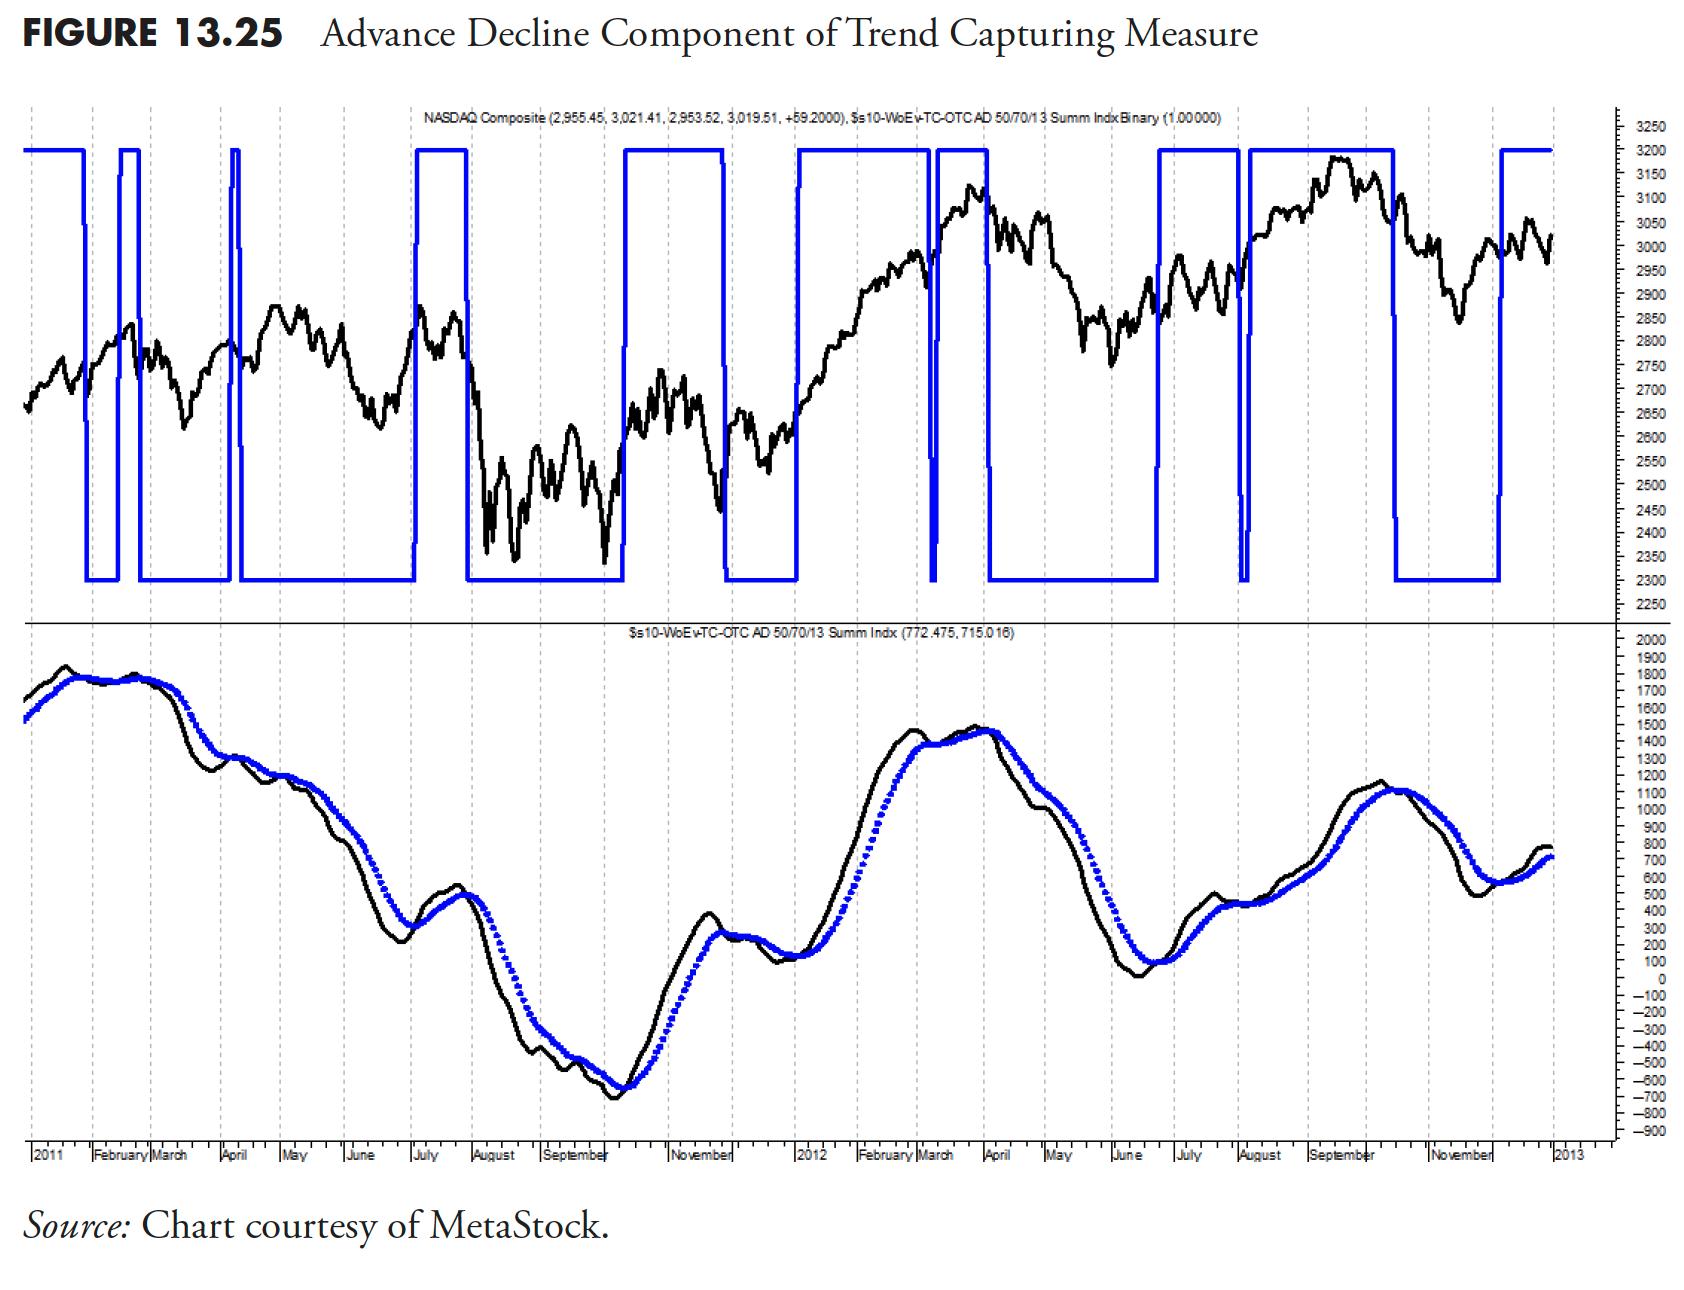
Advance Decline Component
The advance decline component of the trend capturing measure uses the advances and declines difference and then mathematically puts that difference into a relationship similar to MACD (see Figure 13.25). The signals are given by the crossing of that formula with its shorter-term (10–18 periods) exponential moving average.
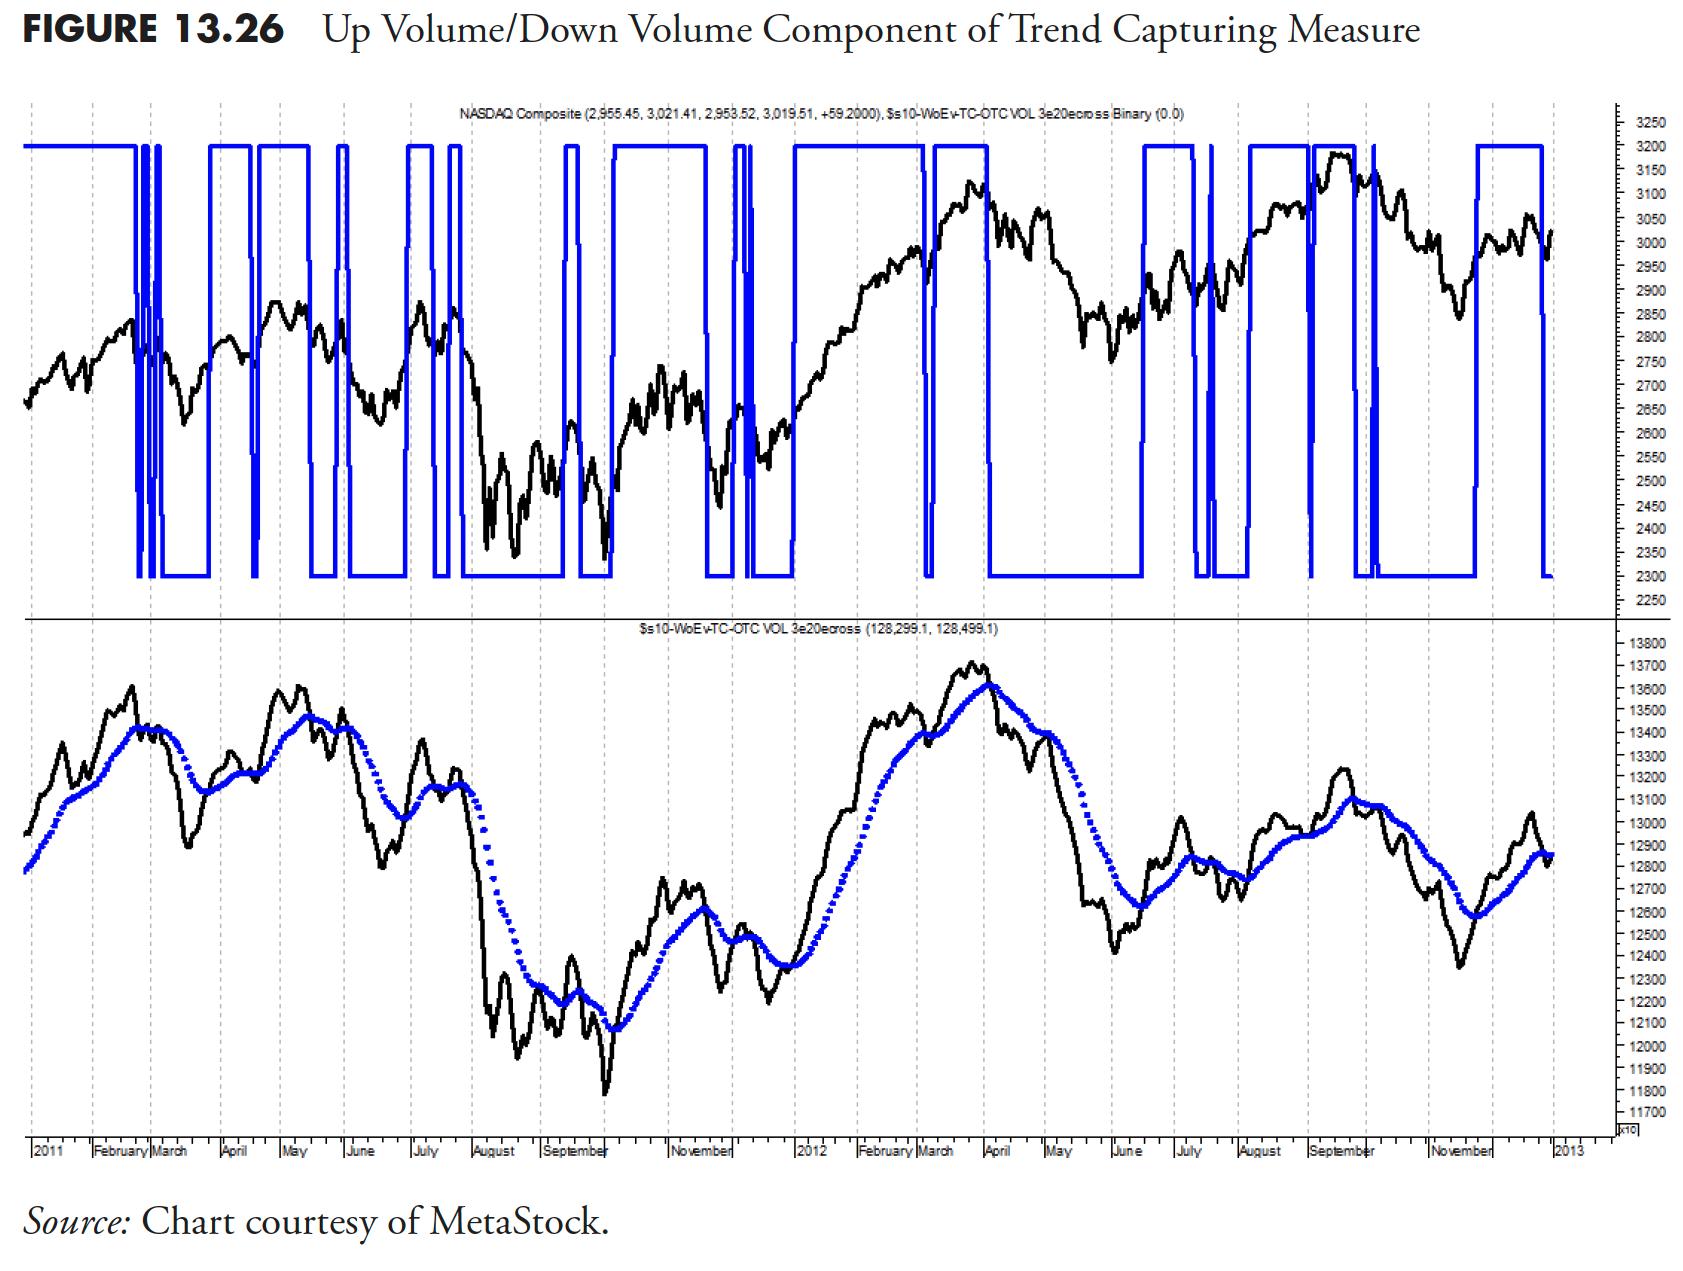
Up Volume/Down Volume Component
The up volume/down volume component of the trend capturing measure (see Figure 13.26) uses the up volume and the down volume in a similar manner as the advance and decline measure in Figure 13.25. One could assume that these would be very similar as they are tied to the same price movement, one by daily changes, and one by the amount of volume behind those changes. However, in the up volume/down volume, the parameters used are somewhat longer than in the advance decline component.
Price Component
The price component of the trend capturing measure (Figure 13.27), like the other two components, uses a similar relationship, but this one uses parameters that are longer than the other two.

Trend Capturing Compound Measure
This is a major component of my model, because it ties directly with the investment philosophy of identifying positive market trends that have a high probability of continuing into the future. I never predict; I only have an expectation that the identified trend will continue.
This component is a composite of three technical measurements. One is a price measure, and the other two are breadth measures, one of which uses up and down volume, and the other uses advancing and declining issues (see Figures 13.26 and 13.27). I use multiple indicators for confirmation purposes. For instance, when the first of these three indicators turns positive, it is telling us there is a positive price trend developing. When the second of these indicators turns positive, it provides confirmation of the trend, and if the third turns positive as well, I know I have a very solid trend in place. See Figure 13.28.
LTM—Long-Term Measure
Sometimes a good way to dampen things is to utilize a longer-term overlay measure, such as this Long-Term Measure (LTM). There are multiple ways to smooth out the noise in data, we’ve discussed one, the moving average, at length. The other, using weekly data, often does the same thing, sometimes even better.
The long-term measure uses only weekly data. It has many components, such as weekly advances and declines, weekly new high/new low data, weekly up volume and down volume data, plus a price component that measures the relationship among many market indices and tracks their position relative to their long-term moving average. All of that data is calculated and then put together in a fairly complex manner to give the binary indicator shown in the top plot of Figure 13.29. It has an intermediate level, sort of a transition zone so that, as the long-term components go from being on to off, they pause in the transition zone to ensure there is follow through. This is a fairly slow moving measure and is best used to identify cyclical moves in the market. The best place to find weekly breadth data is from Dow Jones and Company, in either Barron’s or The Wall Street Journal.
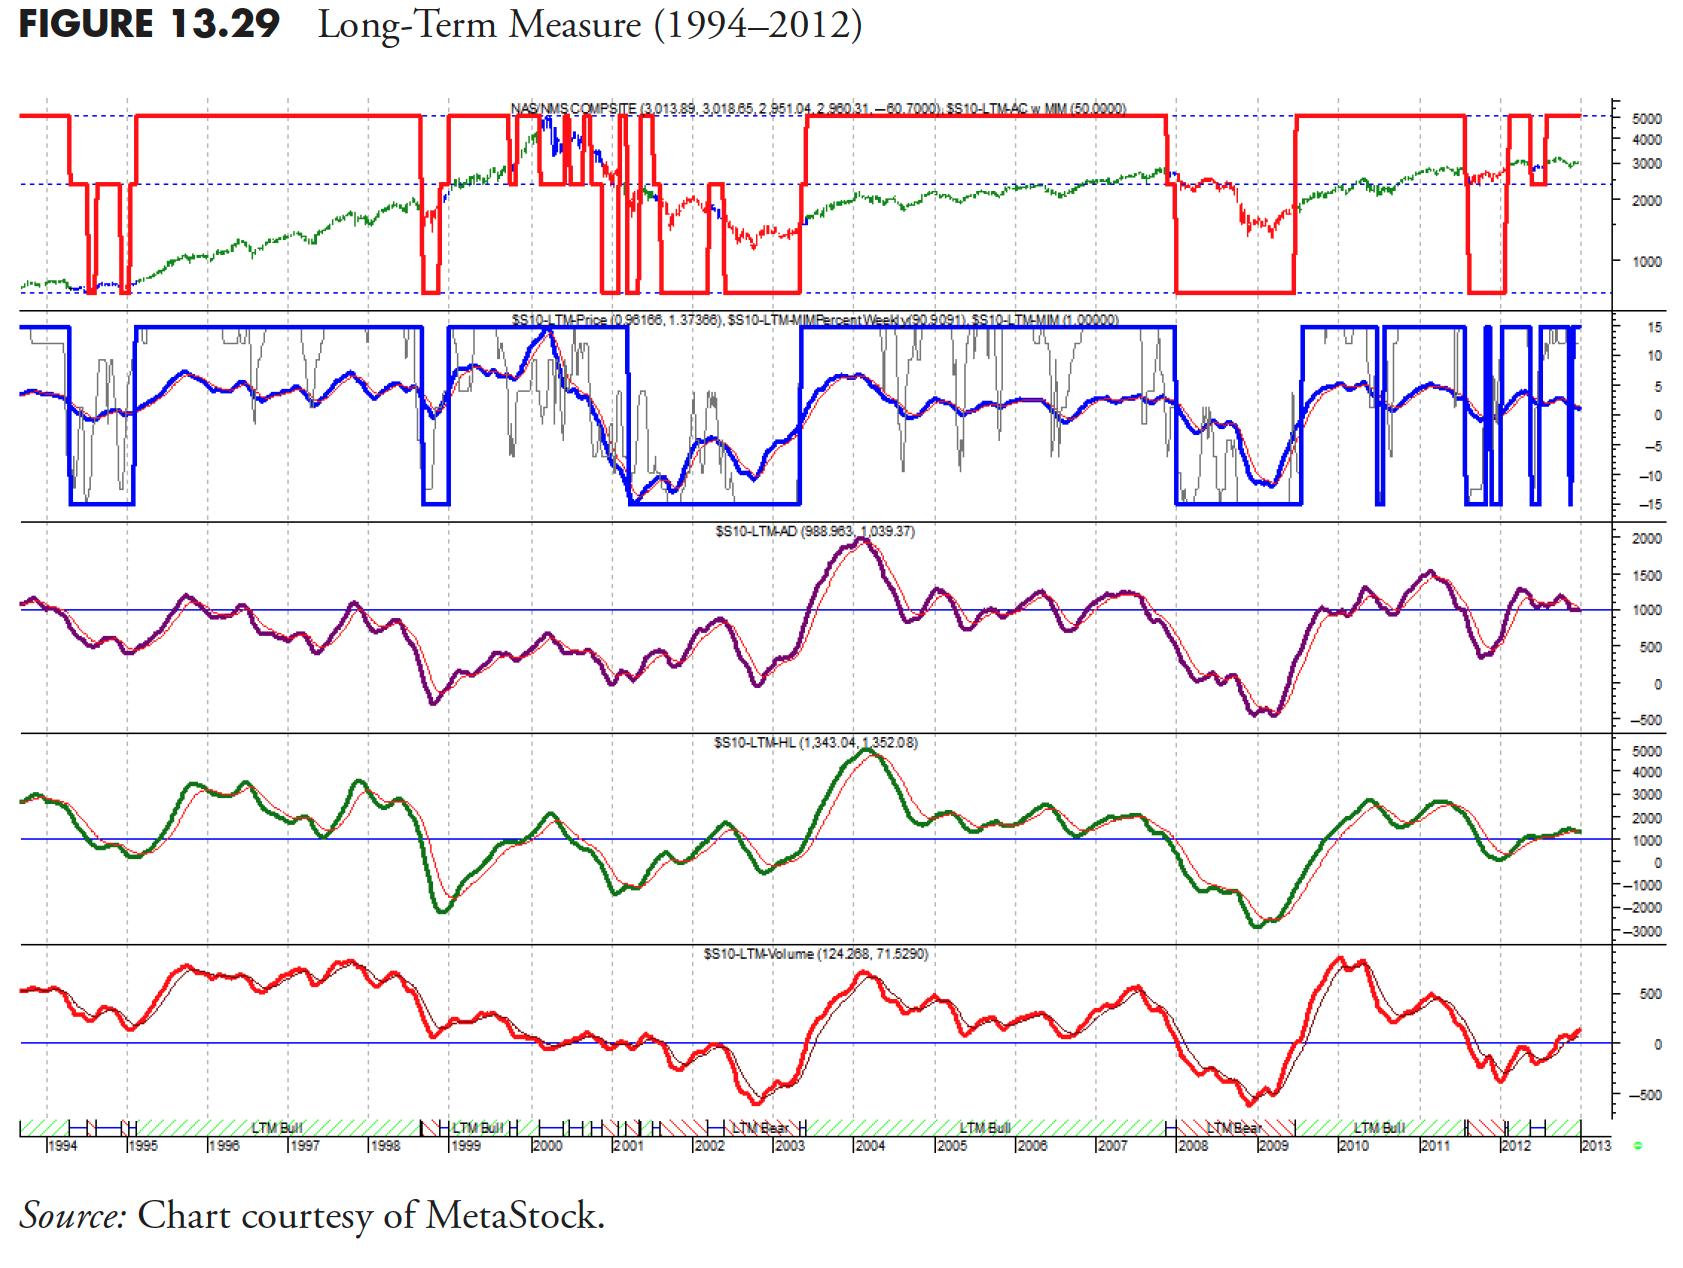
Figure 13.30 shows the long-term measure over a shorter time frame so you can better see the action of each measure.

Bull Market Confirmation Measure
The Bull Market Confirmation Measure is about as simple as it can get. (See Figure 13.31.) It just uses a 50 moving average and a filter to identify bull moves. It is calculated on the average price of the high, low, and close ((H+L+C)/3). The difference between the average price and its 50 period simple moving average is then adjusted to identifying only times when it is outside of the -5% and -10% range. As the average price drops below the -5% value it is a sell signal and when it rises above the -10% it is the buy signal. These crossover percentages are determined based on the price series you are using. They will probably be different for each one.
Figures 13.31 and 13.32 is the Bull Market Confirmation measure with less data, so that you can see the turning points easier.


Initial Trend Measures (ITM)
A significant enhancement to a trend following model is an early warning set of indicators. I call them Initial Trend Measures, or Early Trend Measures. They are designed to measure trends just like the weight of the evidence measure does, but use shorter term parameters in an attempt to pick up or identify the trend at an earlier stage in its development. You can use as many short-term trend measures as you need, but usually 3 is more than enough if you have them in different categories of trend measurement, such as price, breadth, and relative strength.
Figure 13.33 is one of the Initial Trend Measures that utilizes up volume compared to down volume. It can be either the Nasdaq data or the NYSE data. The top plot is the Nasdaq bar chart, with the indicator’s binary wave overlaid on the price bars. Recall that the binary is at the top when the indicator is above its moving average and at the bottom when it is below its moving average.
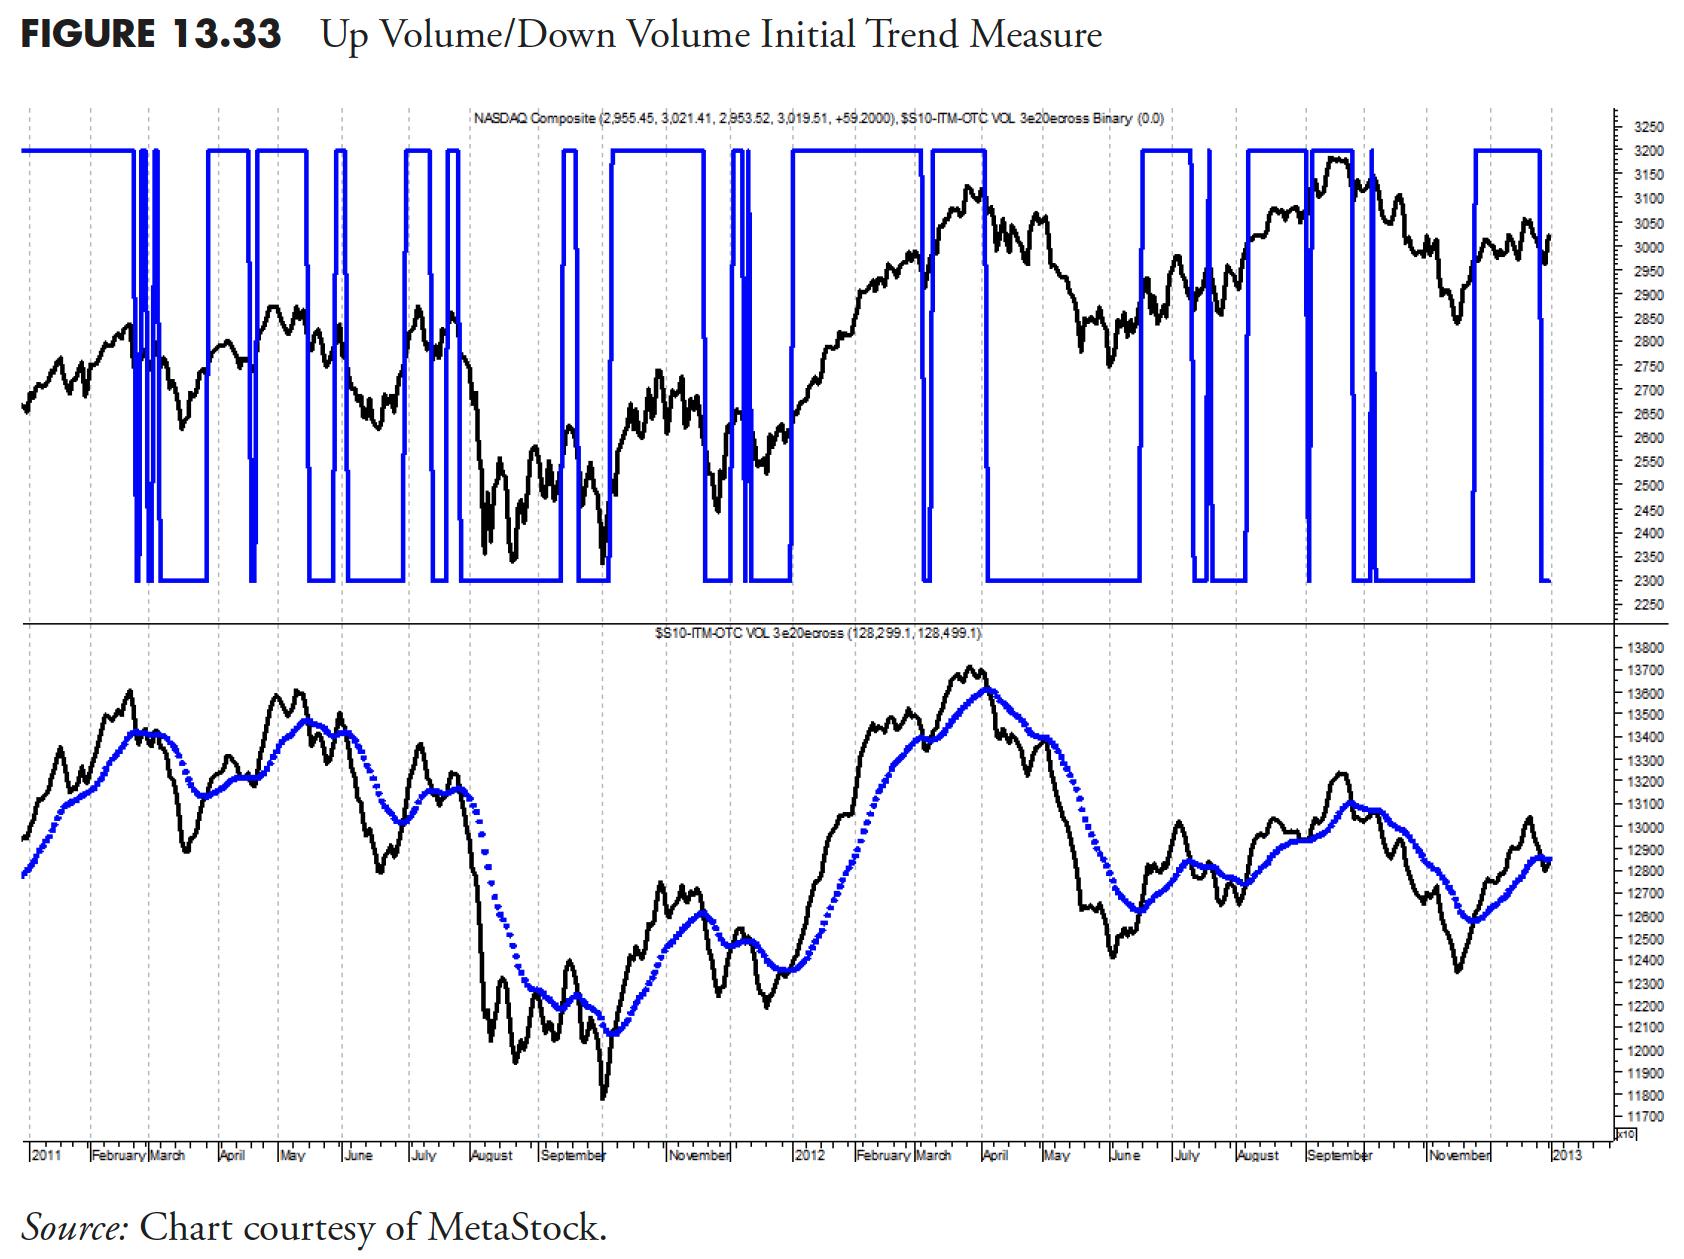
Figure 13.34 shows the Initial Trend Measure, which uses the advance decline data. Just like the other weight of the evidence measures, this uses an MACD approach.
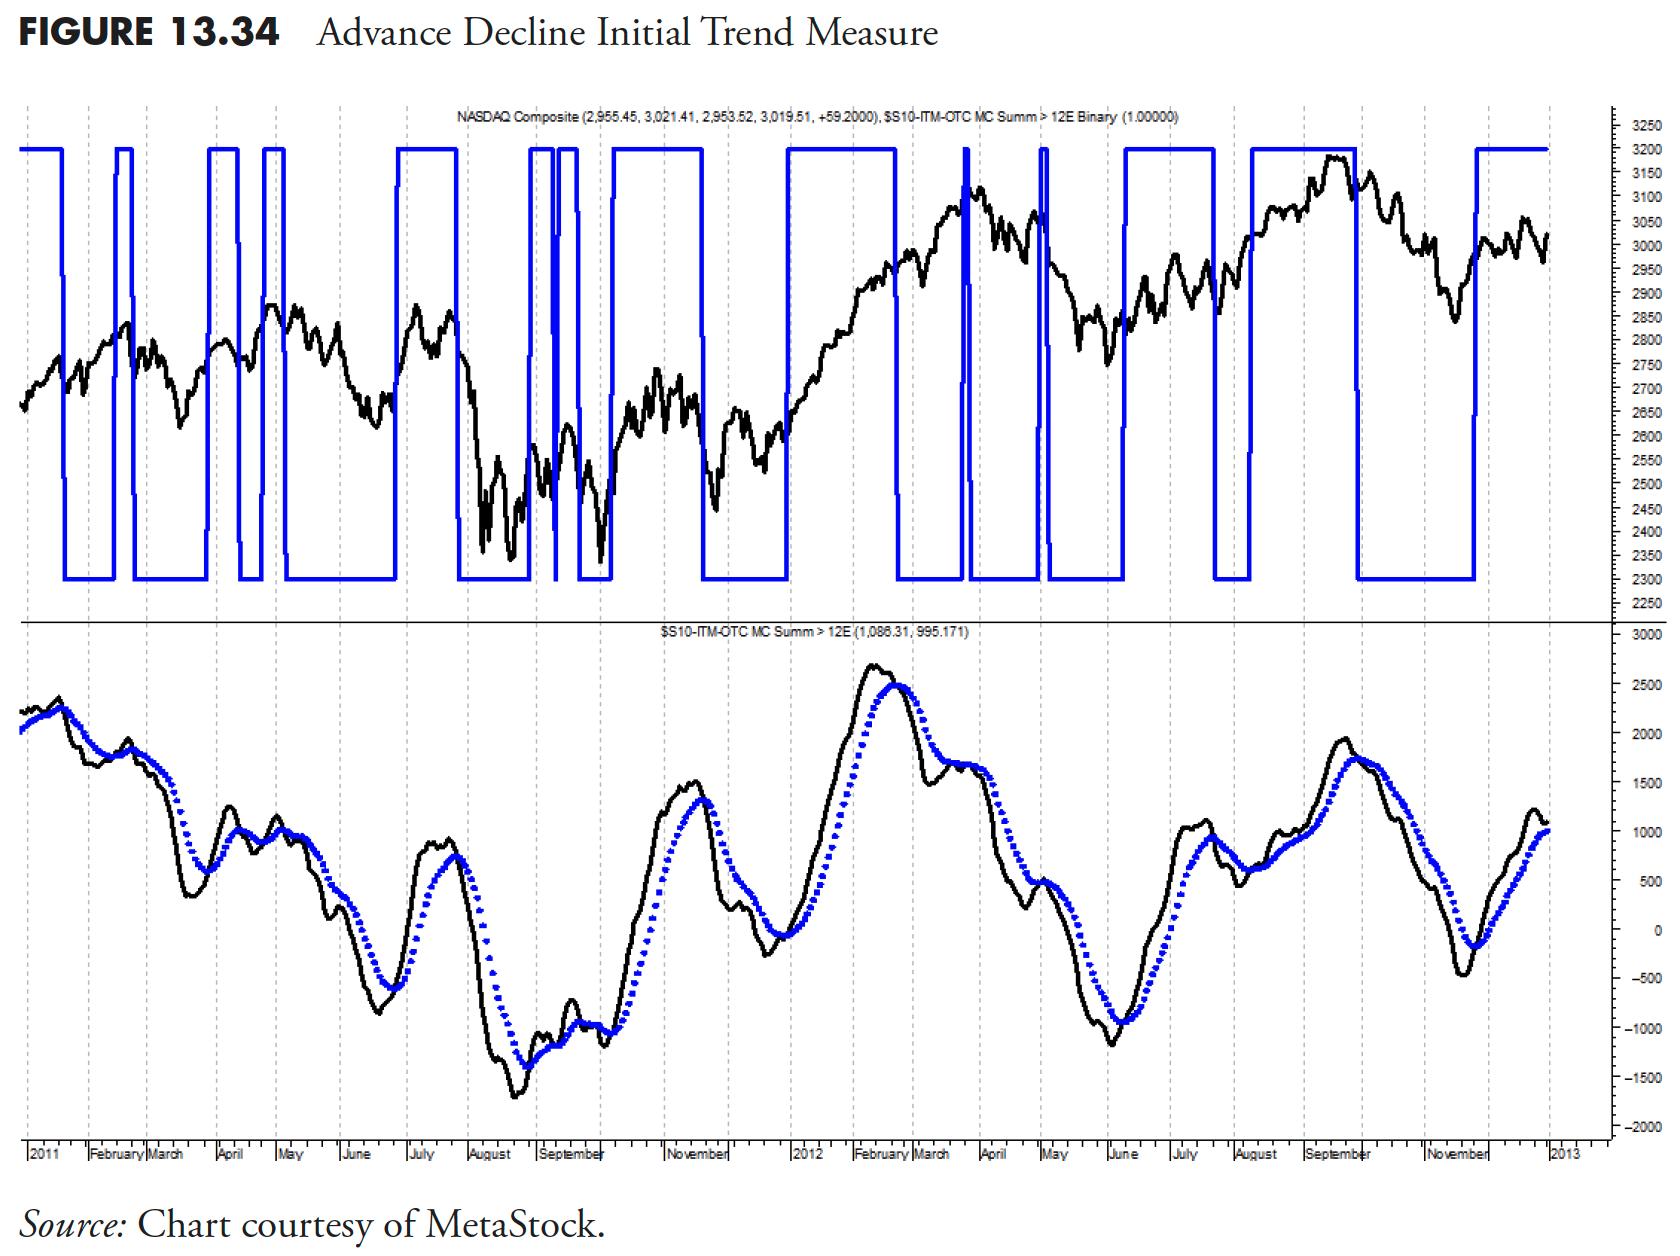
Figure 13.35 is another ITM, this one using price, and in this case it is the Nasdaq Composite Index that is used. This measure is similar to the trend measure mentioned earlier, but using short-term parameters.

Figure 13.36 is a similar initial trend measure, but this one uses the NYSE Composite Index for price.

The Initial Trend Measures provide an alert mechanism for the weight of the evidence. You will also see their use in the next chapter when used along with the trade up rules.
Trend Gauge
This is a concept that was introduced to me by my friend Ted Wong (TTSWong Advisory), referring to the use of multiple market indices and measuring their relationship to their moving average.
Trend Gauge is comprised of Mega Trend Plus and Trend Strength. A concept that attempts to identify overall trendiness in the market is always going to be a valuable tool for a trend follower. For purposes of this example, I selected the ubiquitous 200-day exponential average, then smoothed the results with a three-day arithmetic average. There are a number of modifications one could do with this concept, including optimizing the moving average lengths for each of the market indices. I say that with this warning, optimization must be done properly to avoid curve fitting, and was discussed earlier in this chapter. I would start with moving average lengths that are closely tied to the trend lengths I want to focus on, and then use a short-term noise reduction smoothing like I did in this example.
Mega Trend Plus
Mega Trend Plus is constructed by selecting 11 major indexes with the longest historical database. One could easily make the case for more or less indices and which indices are to be included. I would suggest using enough indices to give you broad coverage over how you plan to make investments. The Mega Trend Plus is also used in the Long-Term Measure (LTM), but in that case it uses weekly data. Clearly if you are going to have a focus on international securities, you would want to include international indices. The list of indices used in this example is:
- Nasdaq Composite
- S&P 500
- S&P 100
- Russell 2000
- Russell 2000 Growth
- Russell 2000 Value
- New York Composite
- Dow Jones Industrials
- Dow Jones Transports
- Dow Jones Utilities
- Value Line Geometric
When the index is greater than its exponential moving average (EMA), it receives a +1; below its EMA, it receives a -1. Then the scores from all 11 indexes are summed and then normalized so the composite will have a range between 0% and 100%. An uptrending market is called when the composite is greater than or equal to 85%. A downtrending market is when the composite is less than or equal to 15%. Once a threshold is crossed, the market stance stays until the opposite threshold is penetrated. Hence Mega Trend Plus is a digital meter: either bull or bear.
Figure 13.37 shows the S&P 500 in the top plot, Mega Trend Plus in the lower plot, and the Mega Trend Plus binary overlaid on the S&P 500. The binary is at +1 when.ever Mega Trend Plus is greater than or equal to 85, at -1 whenever Mega Trend Plus is less than or equal to 15, and at zero when it is between 15 and 85. You can see that it does a reasonable job of trend identification. This is a weight of the evidence approach that is totally related to the concepts in this book.

Trend Strength
Trend Strength is a different composite, which is the sum of 11 ratios. For each market index, a ratio is calculated with this formula: (price/EMA–1) x 100 percent. The EMA lengths are identical to those used in Mega Trend Plus. The ratio depicts how far away (up or down) the index is positioned relative to its EMA. Hence, Trend Strength is an oscillating analog meter that measures the momentum of each of the 11 market indexes (see Figure 13.38).

Trend Gauge combines the readings from both the digital and analog meters (Mega Trend Plus and Trend Strength). It represents a weight of evidence approach in determining both the direction (digital) and the strength (analog) of the overall market trend. Figure 13.39 shows the S&P 500 in the top plot and Trend Gauge in the lower plot. Whenever the Trend Gauge is at +1, it has identified an uptrend; when at -1, it has identified a downtrend; and when at 0, there is neither an up- or downtrend (neutral).

Figure 13.40 is the same data as in Figure 13.39 , just over a much longer time frame. The beginning date in Figure 13.40 is 1992.

Measuring the market is a significant component to a good trend following, rules-based model. This article and the previous one have introduced many measures that can be used individually or in groups to assist in trend identification. Clearly, there were many measures introduced, and hopefully you can find a few that will fit your needs. Also, hopefully you will not use all of them, as many are similar with minor deviations in their concept.
Thanks for reading this far. I intend to publish one article in this series every week. Can’t wait? The book is for sale here.