


After a corrective action in the previous week, the Markets continued to wear a tentative look throughout the past week as well. In the previous technical note, it was mentioned that the level of 22525 has now become an intermediate top for the markets and any runway upsides should not be expected. It was also mentioned that this corrective undertone might persist for some more time. Volatility also cooled off as India Vix declined by 10.74% to 12.22. The markets continued to stay and trade on the analyzed lines while they oscillated in the 470-50 points range over the past few days. The headline index finally closed with a negligible gain of 73.40 points (+0.33%).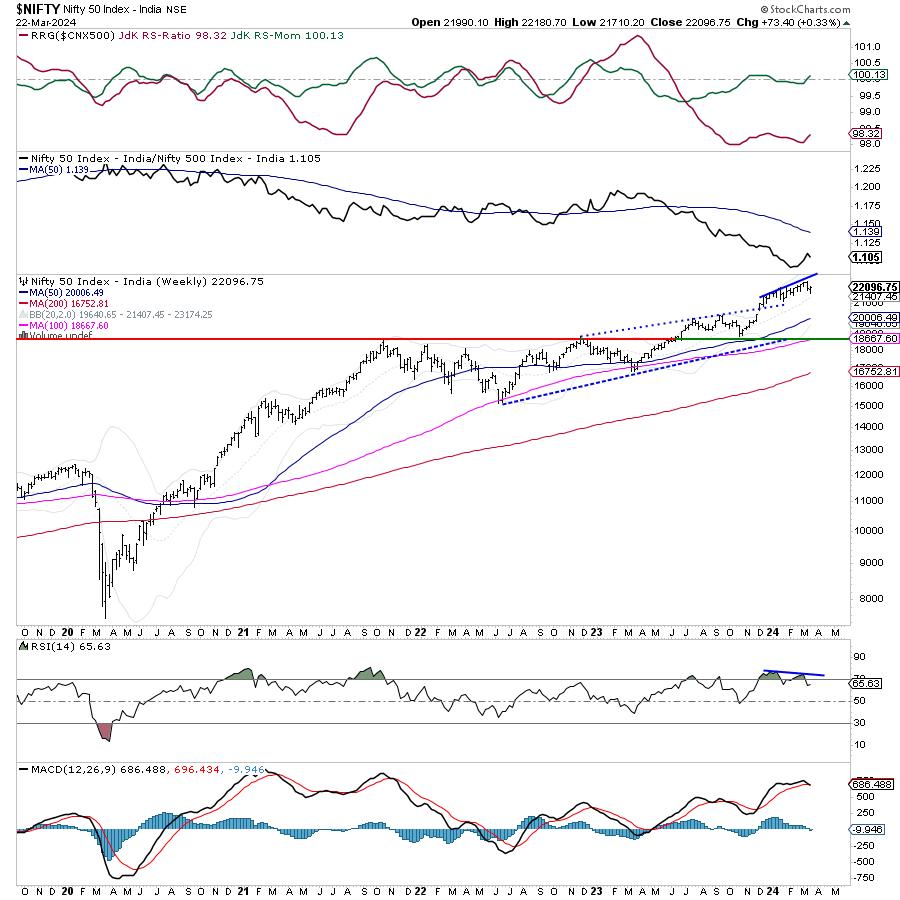
Nothing much should be expected from the coming week; the markets are likely to stay in a defined range with no tangible upsides visible beyond a few technical rebounds. Importantly, we have monthly derivatives expiry lined up. Also, on top of it, we have just a 3-day trading week. Monday is a trading holiday on account of Holi and Friday is a trading holiday on account of Good Friday. The monthly derivatives expiry and the short trading week may not support the markets for any kind of runaway upmove taking place. The previous week’s high point is likely to act as resistance over the coming days; bay and large, besides any intermittent technical rebounds, we are unlikely to see any runaway kind of upmove.
The coming week is expected to see the levels of 22200 and 22380 acting as immediate resistance points for the markets. The supports come in at 21700 and 21610 levels. The trading range is expected to stay moderately wider than usual.
The weekly RSI stands at 65.63; it stays neutral and shows no divergence. However, when subjected to pattern analysis, it shows a negative divergence against the price. The weekly MACD has shown a negative crossover; it is now bearish and trades below its signal line.
The pattern analysis shows that the last phase of the upmove that the Nifty had has come with a negative divergence of the RSI against the price. While the price marked higher highs, the RSI did not and this led to the negative divergence. In the process, the Nifty has also formed an intermediate high at 22525 levels. The nearest support exists in the form of a 20-week MA which currently stands at 21407. This may keep the markets under corrective pressure; no significant upmove can be expected and the corrective undertone may continue to persist for some time.
All in all, we are likely to see banking and finance space trying to improve their relative performance. Besides this, the defensive pockets like IT, Pharma, FMCG, etc., may see some resilient show as they try to improve their relative strength against the broader markets. It should be noted that all upmove or technical rebounds are likely to find selling pressure at higher levels. It is strongly recommended to use all technical rebounds as and when they occur to protect profits at higher levels. While continuing to stay highly selective in approach, a cautious outlook is advised for the coming week.
Sector Analysis for the coming week
In our look at Relative Rotation Graphs®, we compared various sectors against CNX500 (NIFTY 500 Index), which represents over 95% of the free float market cap of all the stocks listed.
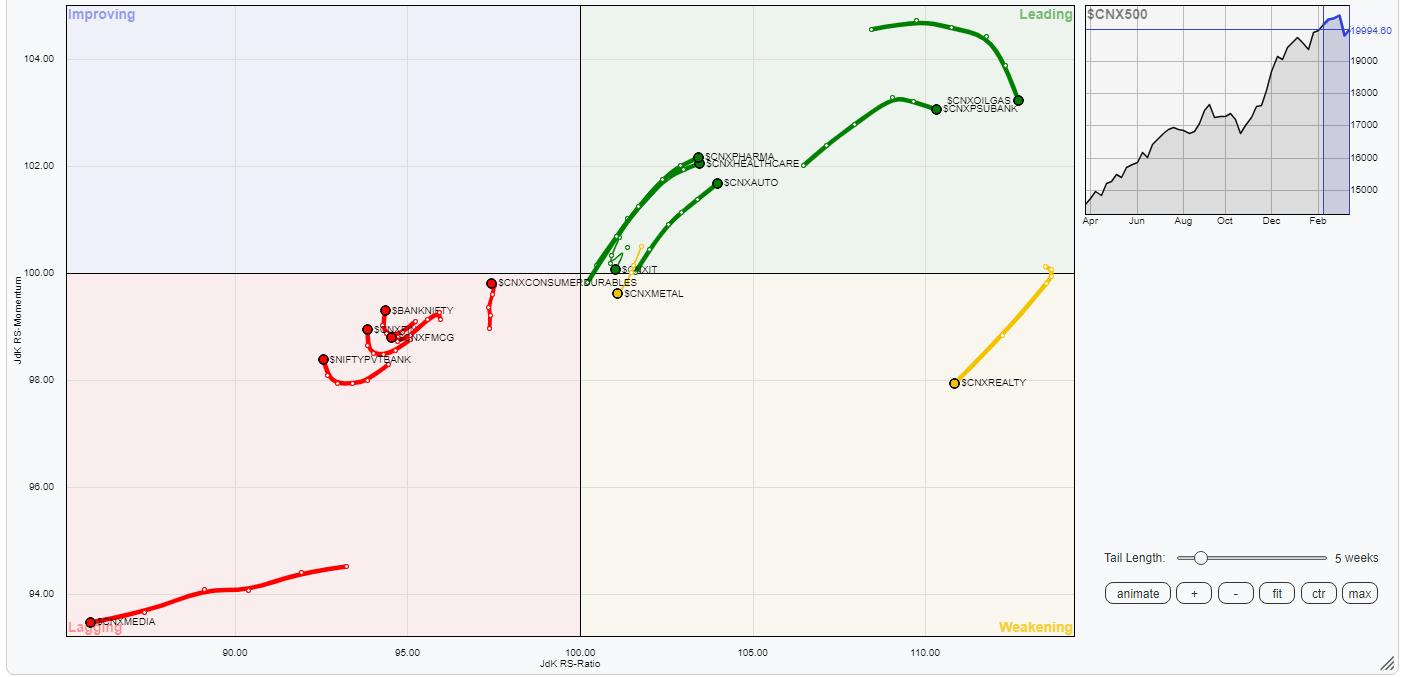
Relative Rotation Graphs (RRG) show that we can expect relative outperformance from Nifty Auto, Commodities, IT, Energy, Pharma, Infrastructure, Nifty PSU Bank, and PSE stocks as these groups are placed inside the leading quadrant. However, few among these groups like PSE, Commodities, and Energy are showing some slowdown in their relative performance against the broader markets.
The Midcap 100, Metal, and Realty Sectors are inside the weakening quadrant. Individual performance might continue but we can expect the relative performance to get weaker from this space.
Nifty Media continues to languish inside the lagging quadrant. Nifty Bank, Services Sector, Financial Services, and FMCG sectors are also inside the lagging quadrant, but they are seen improving on their relative momentum against the broader Nifty 500 index.
The Nifty Consumption Index is inside the improving quadrant.
Important Note: RRG™ charts show the relative strength and momentum of a group of stocks. In the above Chart, they show relative performance against NIFTY500 Index (Broader Markets) and should not be used directly as buy or sell signals.
Milan Vaishnav, CMT, MSTA
Consulting Technical Analyst